Research

Research

Developing technology, process and art to protect the pollinatiors

Jesús Dominguez Ph.D. and Antonio Quintero Rsr., installing and calibrating bee recording equipment using specialized equipment at BeeRing Mexico (2020)

The The BeeRing research team with the mission of understanding and mitigating the growing threat and disappearance of the bees, have been conducting and facilitating noninvasive research on bee focused on basic studies on mechanisms of communication and behavior to applied studies on bee breeding and colony supervision. One critical threat on colony supervision is the absence of the queen in a beehive as it eventually leads to the death of the habitat formed in the beehive and requires immediate intervention of the beekeeper. Manually searching for the queen is an arduous and recurrent task for beekeepers that upsets the normal life cycle of the beehive and can be a source of stress for bees. The beekeeper must open the beehive and remove each frame trying to spot the queen, repeating this task periodically in the field.

At industrial scale, such as pollination of almond fields, the bee’s welfare is constantly in peril, hundreds of beehives are loaded in trucks facing not only long and stressful trips, but also constant alteration of their microclimate as the beehives are regularly opened to search for the queen. Sound is a potential but elusive indicator for signaling different states of the beehive, including the absence of the queen bee, and might be used to avoid the stress on the bees as the beehives housing them are regularly opened searching for the queen.

The BeeRing research team has been working on the detection of the bee queen presence via Blind Signal Separation (BSS) of the sound generated inside the beehive and acquired by four miniature unidirectional microphones located inside the beehive. As in other circumstances, sound signals generated in a beehive are mixtures of several sound signal sources which are active simultaneously. This BBS-based technique developed by the authors clearly and unequivocally characterizes the presence of the queen within a beehive. The BSS technique used to detect the presence of the bee queen is an emerging technique of data analysis that recovers unobserved signals or “sources” from observed mixtures (in this case, a mixed sound generated in the beehive by different sources and acquired by four microphones), exploiting only the assumption of mutual independence between the signals. BSS is apparently magical as it estimates the original source signals without knowing the parameters of mixing and/or filtering processes. In fact, without some a priori knowledge, it is not possible to uniquely estimate the original source signals. However, it is feasible estimating up to certain indeterminacies that can be mathematically expressed as arbitrary scaling, permutation, and delay of estimated source signals.      

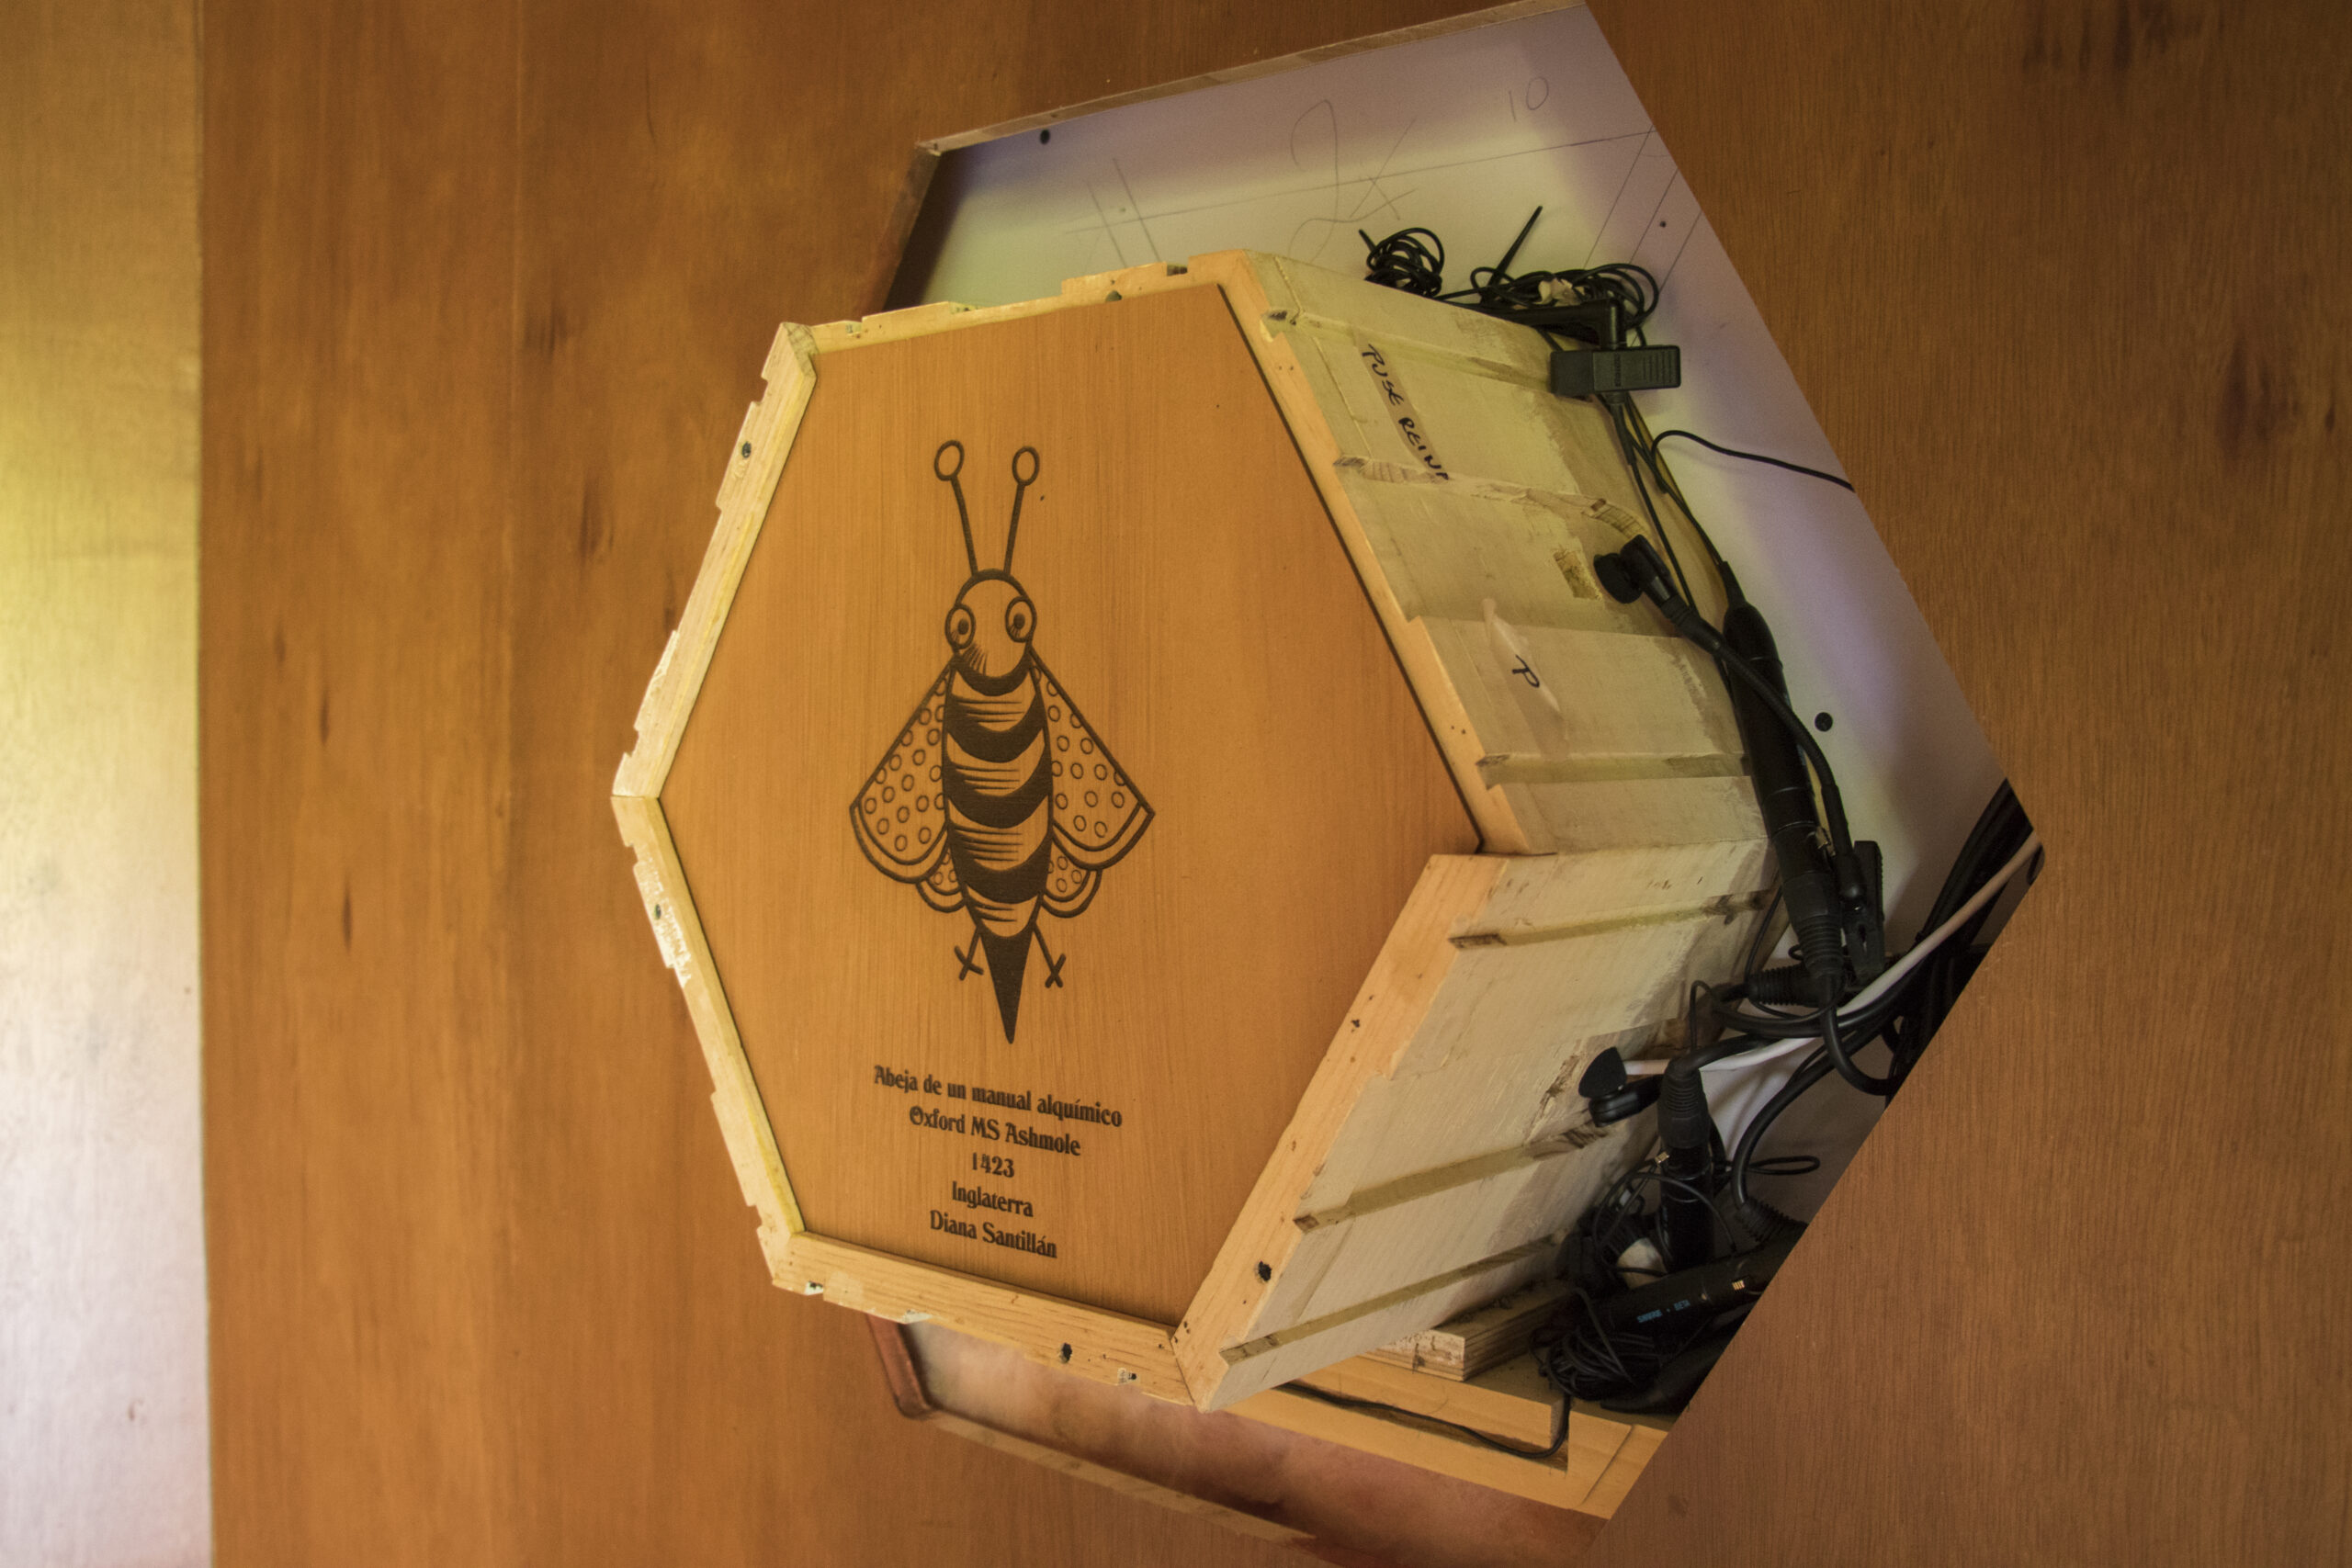
Six miniature unidirectional microphones mounted in one of the beehive habitats inserted in the walls of the BeeRing hut

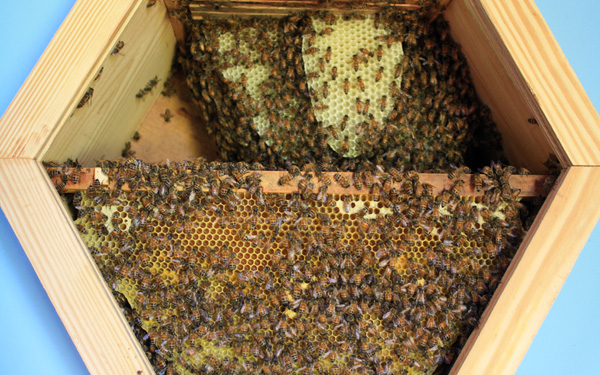
Bees freely fabricating their own combs in the beehive habitat

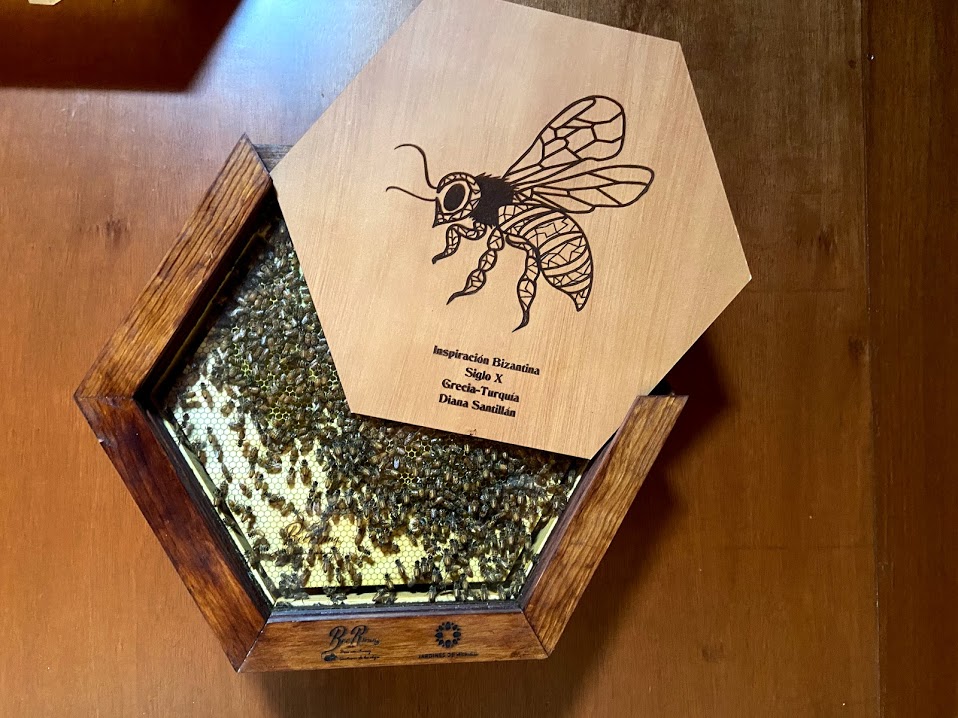
Beehive habitat equipped with a glass to transitorily observe the bees and a sliding wooden pane to cover the glass and keep the bees undisturbed

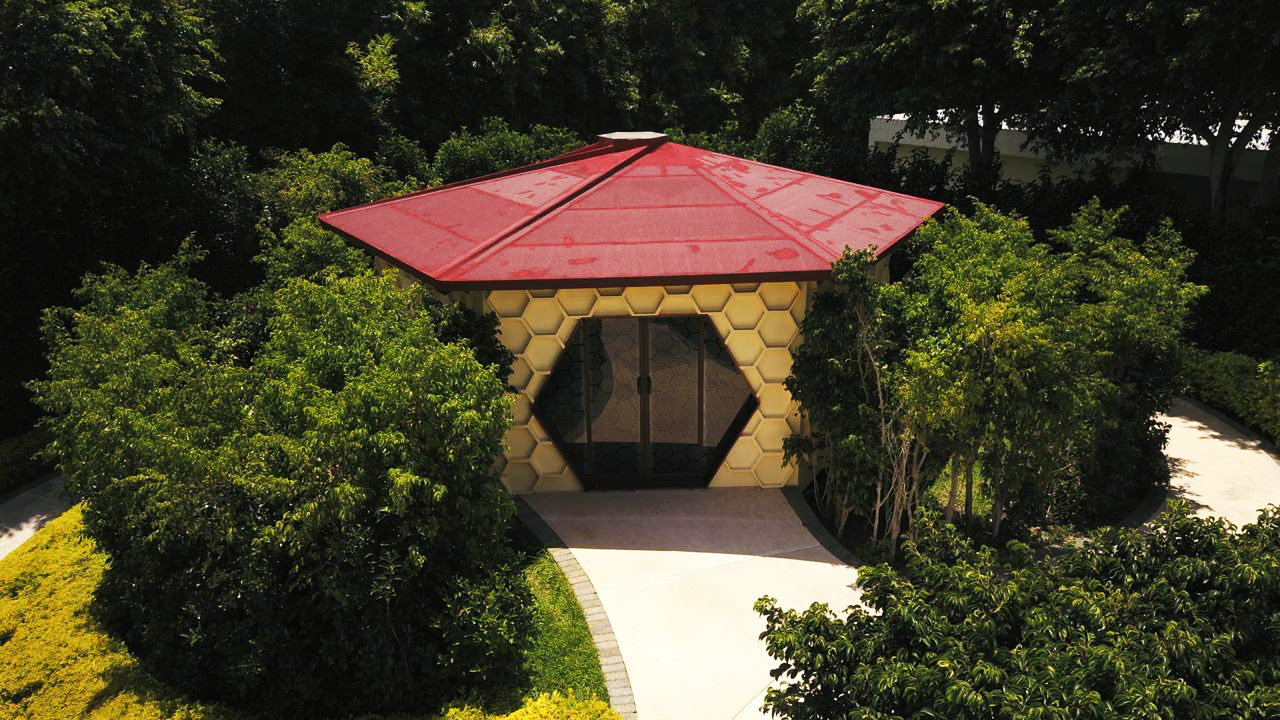
The BeeRing hut built in Jardines de Mexico botanical garden housing the bee habitats

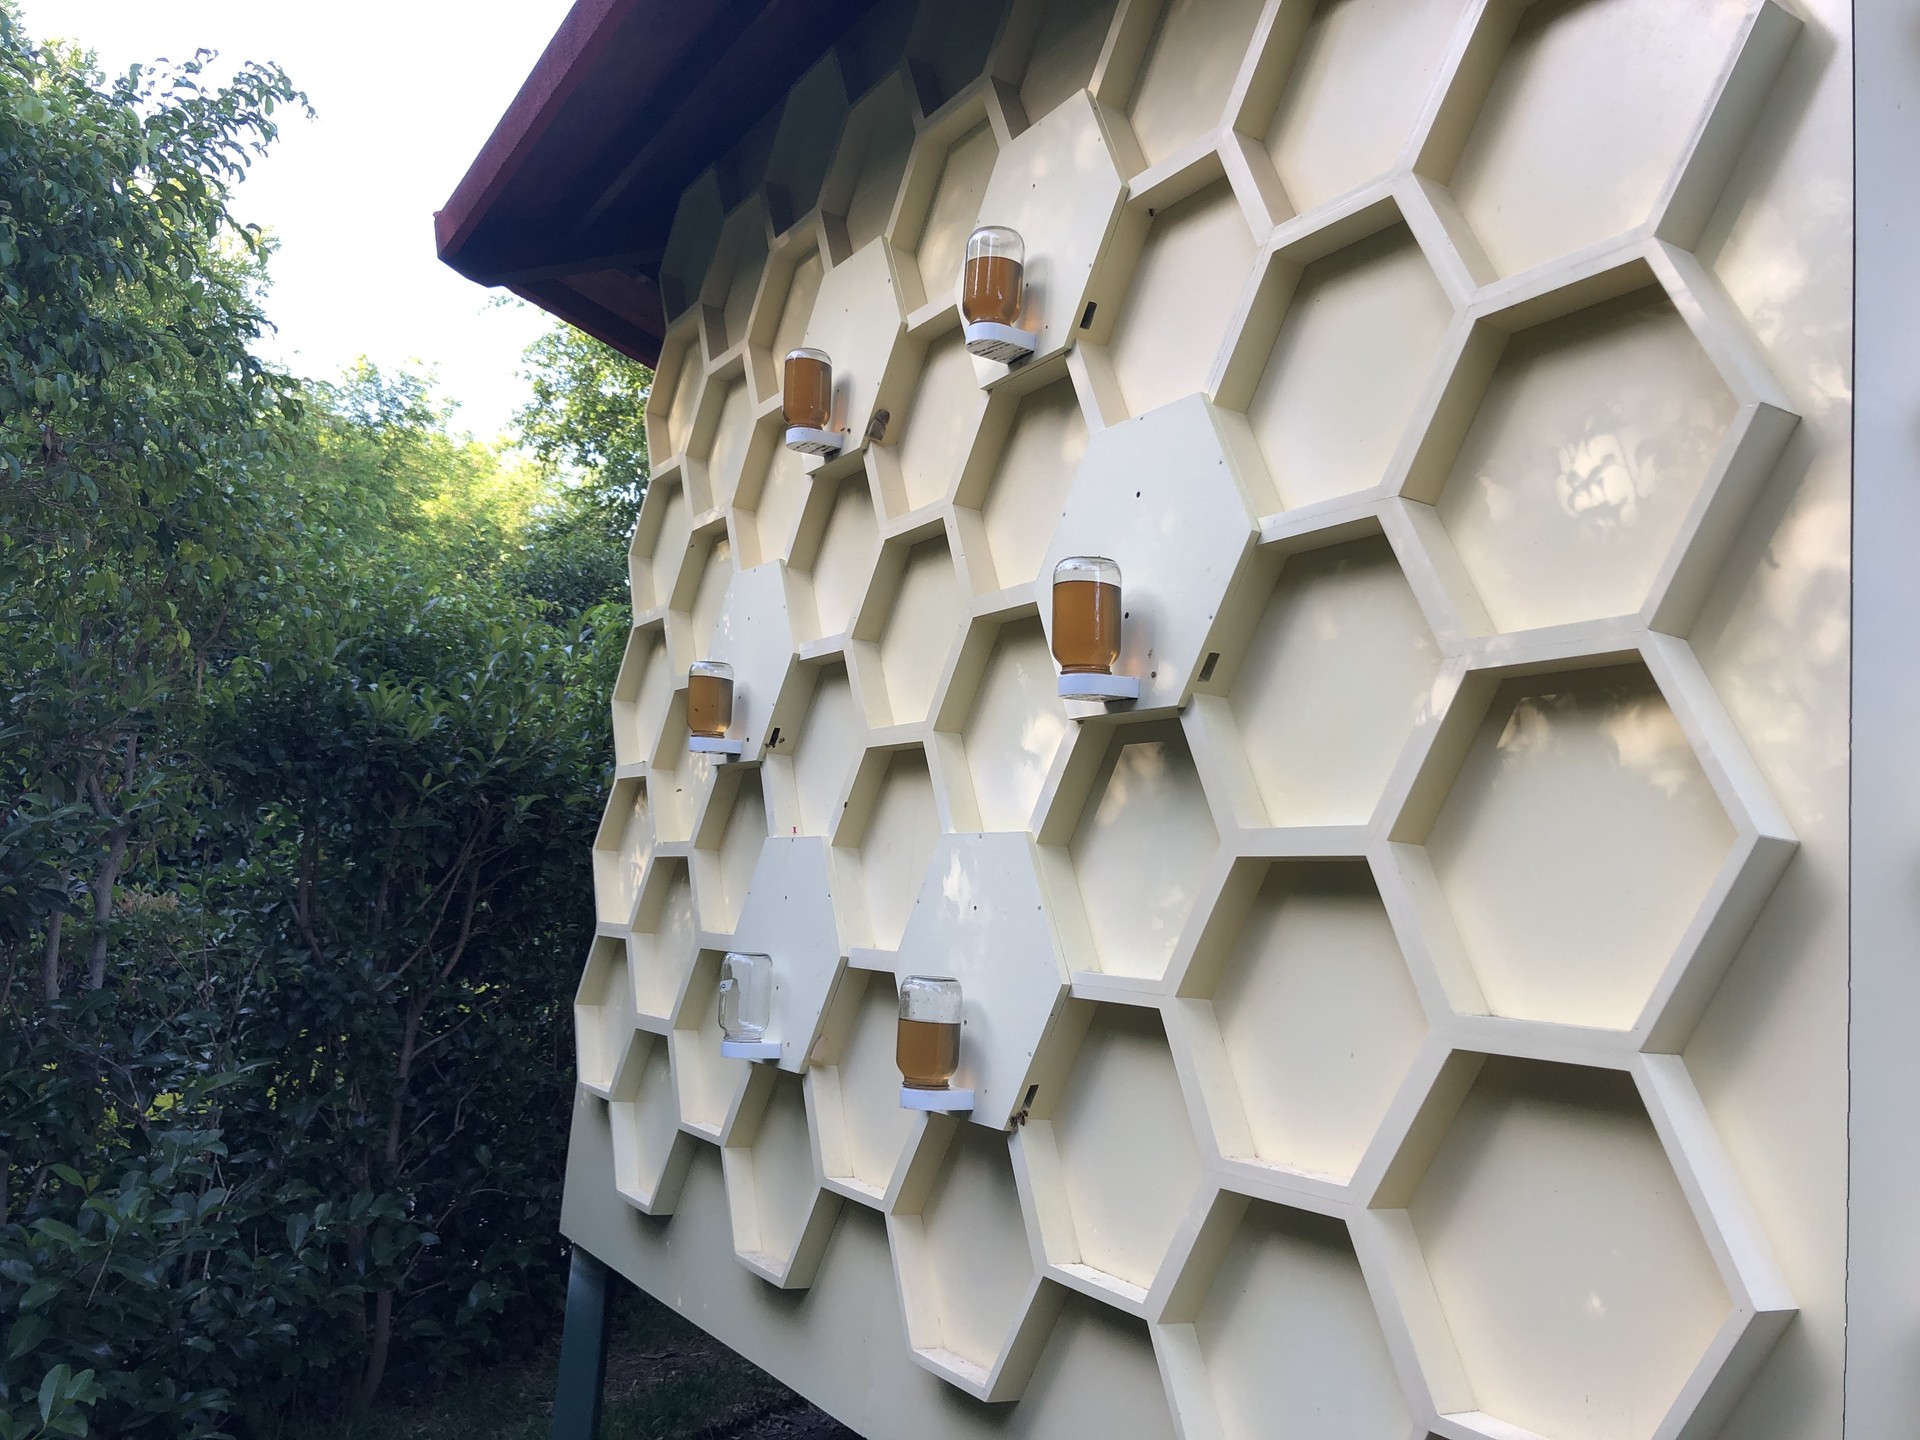
Exterior wall with holes to allow the bees to access the individual beehive habitats

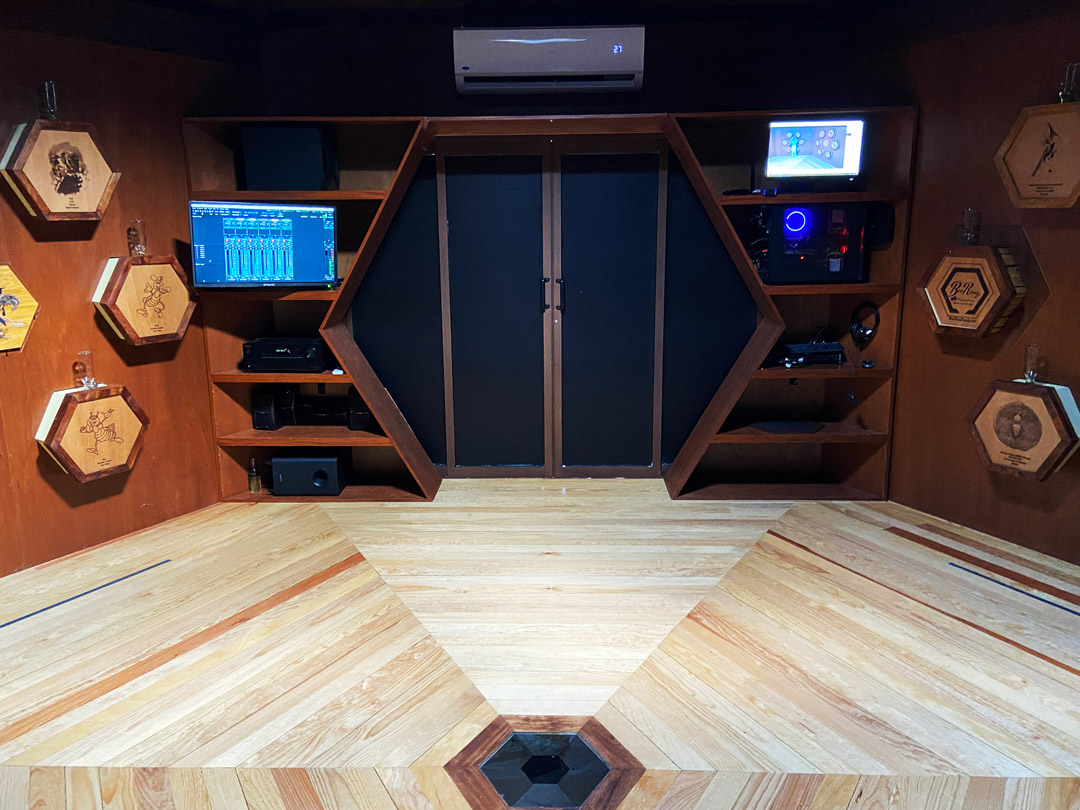
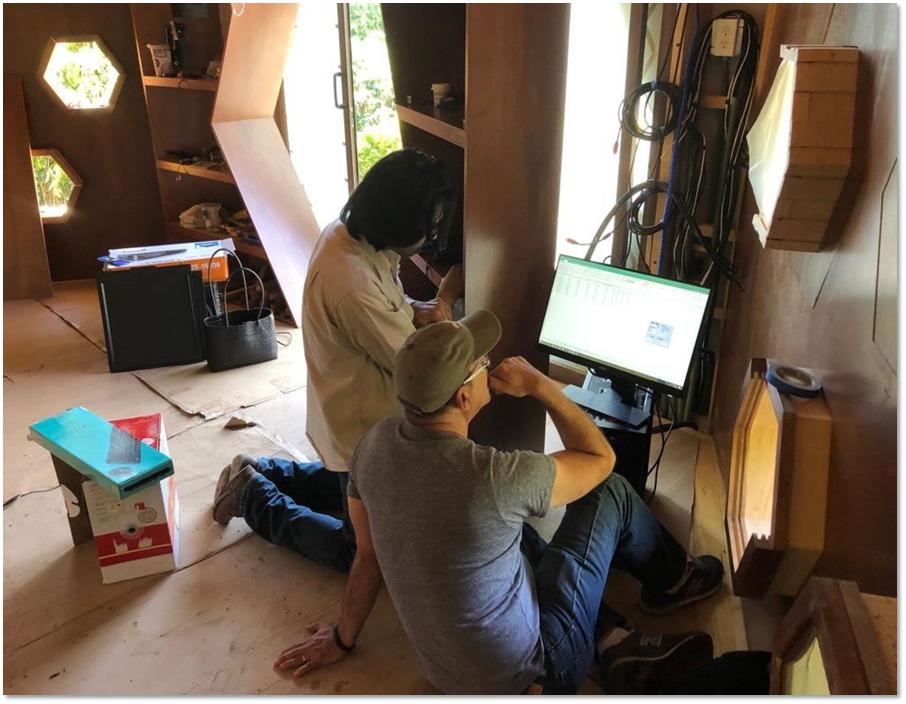
Research equipment to monitor bee hives. Interior view of the BeeRing hut having up to six habitats inserted in five of the six walls.

Two sound signal sources in a beehive with a queen extracted via BSS from four microphones.

Two sound signal sources in a beehive without a queen extracted via BSS from four microphones.

The adjacent figure depicts the sound signal in time and frequency domains respectively of the second signal source extracted from the mixed sound acquired by four microphones installed in beehives without and with queen at nine separated 15-minute intervals during the day, starting at 6 AM and ending at 2 AM of the following day covering periods in which the bees perform a variety of functional activities inside the beehive including those in which they reach the lowest activity point that happens between 11 PM  and  4 AM during the summer. The sound intensity profile (Y values expressed in dB) generated in beehives housing a queen and depicted in Figures a through i in the frequency domain clearly differs from the sound intensity profile generated in beehives without a queen; in both cases, the predominant sound signal intensity in all nine separated 15-minute intervals predominantly happens within the 0 to 250-300 Hz range. In contrast with beehives without queen, the sound signal intensity in beehives with queen in all nine 15-minute intervals happens to be extended beyond to 250-300 Hz indicating that the presence of the queen apparently leads to the generation of at least two or three harmonics of the fundamental frequency of 250-300 generated by the bees during a number of key bee activities, such as flying, waggle dance or dance language used to indicate the nectar source, fanning, and buzz running

Sound Signal Sources and Fast Fourier Transform

Mel-Spectogram

Figure on the left depicts the Mel(melody)-Spectrogram of the second source of the sound signals extracted in all nine 15-minute intervals and depicted in the second column of Figure above (frequency domain transformation of the sound signal in the first column via Fast Fourier Transform (FFT)). Mel-Spectrogram is computed by applying the Fourier transform to analyze the frequency content of a signal and to convert it to the mel-scale, a perceptual scale of pitches judged by listeners to be equal in distance from one another. In this Figure is even more evident than in Figure above that several harmonics are primarily generated when the queen is present even in those 15-minute intervals (Figures h and i) within 11PM-to-4AM period when the bees are thought to bear the lowest activity point (Cejrowski, et al., 2020). A frequency threshold value of 260 Hz marked with a yellow line in all mel spectrograms of this Figure (with queen in the right column and without queen in the left column); above this 260-Hz threshold value, positive mel-scale values (light brown color) are predominantly generated when the queen is present, while negative mel-scale values (dark blue) are predominantly when the queen is absent.

Both analyses, FFT and Mel-spectrogram depicted in Figures 1 and 2 respectively, on the second source of mixed sound signals generated in beehives without and with queen, acquired by four microphones, and extracted via BSS in nine 15-minute intervals, show the predominancy generation of harmonics of 250-300-Hz, that as reported in the literature by a number of authors happens to be a fundamental frequency generated by the bees in a number of crucial activities as stated above. As expected, the analysis values, intensity in FFT and Mel-scale in the Mel-spectrogram, at those harmonic frequencies happen to be higher and more recurrent during the 15-minute intervals when the bees are more active; these analysis values at the harmonic frequencies fade and become less recurrent during the 15-minute intervals when the bees are reported to reduce their activity. This important differentiation driven by the separation of the different sources of the sound signals generated at the beehives via BSS approach opens pathways to not only detect the presence of the queen but also to determine other states of the colony and build a ML-based system that can analyze all these states in real time.